|
|
Properties Control Bar Using the Properties control bar. |
Properties Control Bar
The Properties control bar is a context sensitive settings table, updated on selection of data in the Plots, Tables, Logs, 3D and Reports windows.
Follow the links below to find out more:
This control bar offers methods of formatting the selected property, using an object-browser style interface. The menu displayed depends on the type of object selected and in which window it has been selected.
Window Data Object Properties:
The following categories and fields are displayed when object data (not a plot item) or annotation is selected (highlighted) in the Design or Plots windows:
General:
Share: in a multi-sheet data window (Plots, Logs, Tables or Reports - for an overview of how sheets, projections and overlays are handled in your application, see View Hierarchy) you can elect to make the current object available to all sheets (and corresponding projections and overlays), the current sheet (only sharing the data across the projections and overlays relevant to the current sheet) or not shared (meaning the object data will only be available to the current sheet/projection/overlay combination.
3D Object: this read-only field displays the name of the currently selected object, and its associated data type (in brackets).
Color:
Legend: this drop-down list contains descriptions of all available legends (system and user-defined) that can be applied to the selected data column, providing the Use Legend field is set to [Yes].
-
-
For more information on creating and applying legends, please refer to your Legends online Help.
-
Use Legend: if [Yes] is selected, the Legend specified (see above) will be applied to the Column specified (see below), for display purposes. If [No] is selected, the currently selected solid color will be used to display the object.
Column: this drop-down list contains descriptions of the data columns from which the selected object is comprised. You can assign the currently selected Legend to this data column to interpret the display properties of the object.
Appearance:
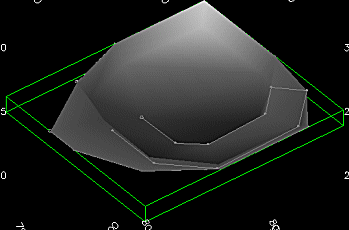
Show Bounding Box: by default, this is set to [No]. A 'bounding box' in CAD terms, refers to a cube surrounding the data extremities of the selected object. If enabled, this box can be seen on screen, e.g.:

The bounding box is always orthogonal to the view axes, so can act as a useful guide to the orientation of the viewplane in the Design window, and the orientation of a section, for example, in the Plots window.
Control:
Can select: select [Yes] (default) to allow this data object to be selected with the mouse, or [No] to exclude it from data selection.
Snap: if you do not wish the selected object to be 'snapped to' when snap mode is on, select [No], otherwise select [Yes] (default).
Plot Sheet Properties
The following options are displayed when a Plan plot sheet is selected (i.e. not a plot sheet projection, nor projection section, nor a plot item):
General:
Name: the name of the current section sheet.
Auto size plot: if enabled, the plot sheet view will be automatically scaled to view all plot items, regardless of their size, fitting everything into the viewing area.
Auto name sheet: if enabled, sheets will be automatically named on creation.
Appearance:
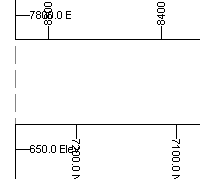
Draw margins: if selected, the margins of the selected media will be shown on the screen as guidelines, e.g.:

(margins shown by grey slatted line).
Size: the print media currently emulated in the Plots window. Select the drop-down list for more options.
Page orientation: specify portrait or landscape.
Show printable area: displays or hides a slashed line denoting the limits of the printable area for the selected media. Data falling outside these limits will not be printed, and may result in printing errors.
Position:
Width/Height: the overall width and height of the selected sheet in mm.
Margins:
Top/Bottom/Left/Right: set the margins of the selected sheet in mm. All four margins are independently configurable.
Projection Properties
The following options are displayed when a Plot Sheet projection is selected:
View Direction:
Share: share the selected projection's view direction with other projections on the sheet. To activate this facility, more than one projection (at least) will need to have a [Yes] value specified for this property. Then, whenever the view direction is changed for any one of those projections, the direction will be updated in all other qualifying view areas.
View Direction: set the view direction by selecting a predefined description from the drop-down list.
Azimuth: set the azimuth of the projection's view direction.
Dip: set the dip of the projection's view direction.
Align with Section: you can set this to [Yes] to force the view direction of the projection window to line up with that of the current section definition.
View Center:
Share: share the selected projection's view center setting with other projections on the sheet. All projections with a [Yes] value - on the same sheet - will be updated if the view center is changed in any of those sections.
X/Y/Z: specify the center point of the view in 3D space.
Use section mid point: if set to [Yes] the center point as currently established by the section definition will be used to center the data view.
Appearance:
Opaque: select [Yes] to have the projection opaque, [No] (default) for it to be transparent.
Section Mid Point: for the current view.
Easting: section mid point X coordinate.
Northing: section mid point Y coordinate.
Level: section mid point elevation (Z coordinate).
Section Orientation: the orientation of a section is set initially when a new sheet is added (Insert | Sheet | ...), but you can change it here at any time; you can either select a predefined alignment using a description from the drop-down list, or set a custom Azimuth and Dip value. Note that these values are automatically populated if a predefined orientation is selected.
Section Definition: the following options are available:
Title: an automatically generated (and non-editable) name for the currently active section.
Section Number: the number of the section according to the current definition.
Share: share the section definition with other projections on the sheet. The section definition can be [Shared], in which case any other projection that has the same [Shared] value will be updated whenever the section definition changes in any qualify projection (for example, making the section 'corridor' wider in one will make it wider in all shared projections).
Conversely, if set to [Not Shared], the section definition will not be updated if other projections are subjected to a section definition change.
The additional settings in this drop-down menu are important; [Consecutive] is a method by which a projection is automatically assigned a unique section number, normally one higher than the highest thus recorded on the sheet. For example, if all projections were set to this value, they could be set to section definitions 1,2 and 3 (or 2,3 and 4 etc.) - subsequent alterations to section 1 would affect 2 and 3, but consecutive sections would still be shown.
(This is a useful way of showing sections either side of a selected central slice in multi-projection sheets)
Finally, [Locked] will do just that; if set to [Yes], it will prevent any changes to the current section definition for the selected section, regardless of any commands run from the menu or command bar. Note that it is also possible to lock other aspects of a projection.
Sections Table:
Use section table: if a section definition file is to be used but is not already loaded, select [Yes] and you will be prompted for the location of a file. If a section definition file is already in use, this field will automatically read [Yes]; this loaded file can be disabled by selecting [No].
Section Clipping:
Width: total clipping width i.e. front plus back clipping distance.
Front: front clipping distance.
Back: back clipping distance.
Apply Clipping: select [Yes] to apply clipping (default for vertical and horizontal sections); select [No] to display all data in front and behind the current section plane.
Secondary Clipping: select [Both], [Front] or [Back] to apply secondary clipping; select [Off] for none (default)
Share: read only value.
Position: the position of the selected projection on the sheet. As plot sheets are 2D entities, this can be defined by setting the required X and Y values to set the bottom left corner location. The resulting Height and Width settings are then used to define the overall size of the projection window.
Width/Height: the width and height of the projection item on the plot sheet in millimeters.
X/Y: the XY origin of the projection item, with 0,0 being the bottom-left corner of the plot sheet.
General: this area deals with view (projection) synchronization; whether data that is selected in one projection is also selected in other projections. The concept of "Linked" and "Live" is important here;
Linked: this refers to how data selection is performed in multiple projections. If two (or more) projections are linked, when you select data in one, it becomes selected in the other(s).
Live: this refers to whether the view of data is automatically updated to show selected data.
One or both of these settings can be activated. For example, if both Linked and Live settings are enabled, if data is selected in one projection, it will be selected in any other projection on the sheet that has a positive Linked setting, and will also force all linked views to update (if required) in order to show the selected data.
By default, all projections are linked, but are not live, meaning that data selection is performed in all projections, but the view scale and direction is not updated.
Scale: you can share the same value for scale across all projections. Note that all projections where the Scale - Share setting is set to [Yes] will be synchronized when any scaling operation is performed in any of those projections
View Exaggeration: you can alter the exaggeration (distortion) of the selected projection in X, Y and/or Z directions, using these fields. By default, data will not be exaggerated (that is, it will be represented in a 1:1:1 ratio, maintaining the aspect ratio of the original data).
Plot Item Selections:
The following categories and fields are displayed when a North Arrow plot item is selected in the Plots window.
The actual menu order and contents will depend on the type of plot item that is selected - only fields relevant to the plot item will be displayed. |
Arrow:
Visible: select [Yes] to display the plot item (default); select [No] to hide it.
3D: select [Yes] to display the arrow in 3D format; select [No] (default) to display the item with a flat appearance.
Color: select an arrow color from the drop-down list.
Bold: select [Yes] to display the plot item in 3D format; select [No] (default) to display the item with a flat appearance.
Size: length of the arrow.
Aspect: aspect width/length aspect ratio of the arrow.
Label:
3D: select [Yes] to display the plot item in 3D format; select [No] (default) to display the item with a flat appearance.
Color: select a color for the arrow from the drop-down list; default [Black].
Font: select a font for the label's text; default [Arial].
Caption: annotation text to be displayed at the top end of the arrow, default is 'N'.
Keep Upright: select [Yes] (default) to keep the label upright.
Size: font size.
Offset: label offset distance from center of the arrow.
Position:
X/Y: the XY origin of the selected plot item, with 0,0 being the bottom-left corner of the plot sheet.
Width/Height: the width and height of the selected plot item in millimeters.
Appearance:
Visible: select [Yes] (default) to display.
Opaque: select [Yes] to have the arrow opaque, [No] (default) for it to be transparent.
Location:
Has Location: default [No].
|
| Related Topics |
| Customizing
Control Bars Data Properties Control Bar Overview |

